

What is the Role of Revenue Transparency in Maintaining Multi-Site Clinic Profitability?
Revenue transparency in a multi-site chiropractic clinic is the structural discipline of making every financial performance metric – claim submission, denial status, collections rate, and aged accounts receivable – visible in real time across every location. It is not a software feature. It is an operational standard that determines whether a growing group practice can identify and close revenue gaps before they compound into cash flow crises.
Most multi-site practices have some form of billing visibility. What they lack is collections alignment. A dashboard that shows claims submitted is not the same as a dashboard that shows claims paid. One measures activity. The other measures revenue. The gap between them is where clinic profitability disappears.
In outpatient clinical settings, between 5% and 10% of medical claims are denied on first submission. Of those denials, up to 65% are never worked or resubmitted. In a single-location practice, that gap is significant. Across three, five, or ten locations running on disconnected billing protocols, it compounds into a structural cash flow problem that no submission dashboard will ever surface.
Decentralized billing workflows increase claim leakage through non-standardized coding and siloed processes. Without location-level reporting that isolates each clinic’s denial patterns, aging AR, and collections-to-submission ratios, a multi-site group cannot distinguish a high-performing location from one quietly losing revenue.
Operational reporting delays correlate directly with accounts receivable aging past 90 days in multi-unit outpatient models. By the time leadership identifies the problem, the most recoverable claims have already aged past the point of return.
True revenue transparency requires four functional layers: visibility into what was submitted, alignment between submissions and actual collections, accountability for denial cycles across locations, and variance reporting that isolates performance differences by site. Without all four layers active and visible, a multi-site practice is managing its revenue cycle on assumptions – not data.
Why Submission Metrics Are Not Revenue Transparency
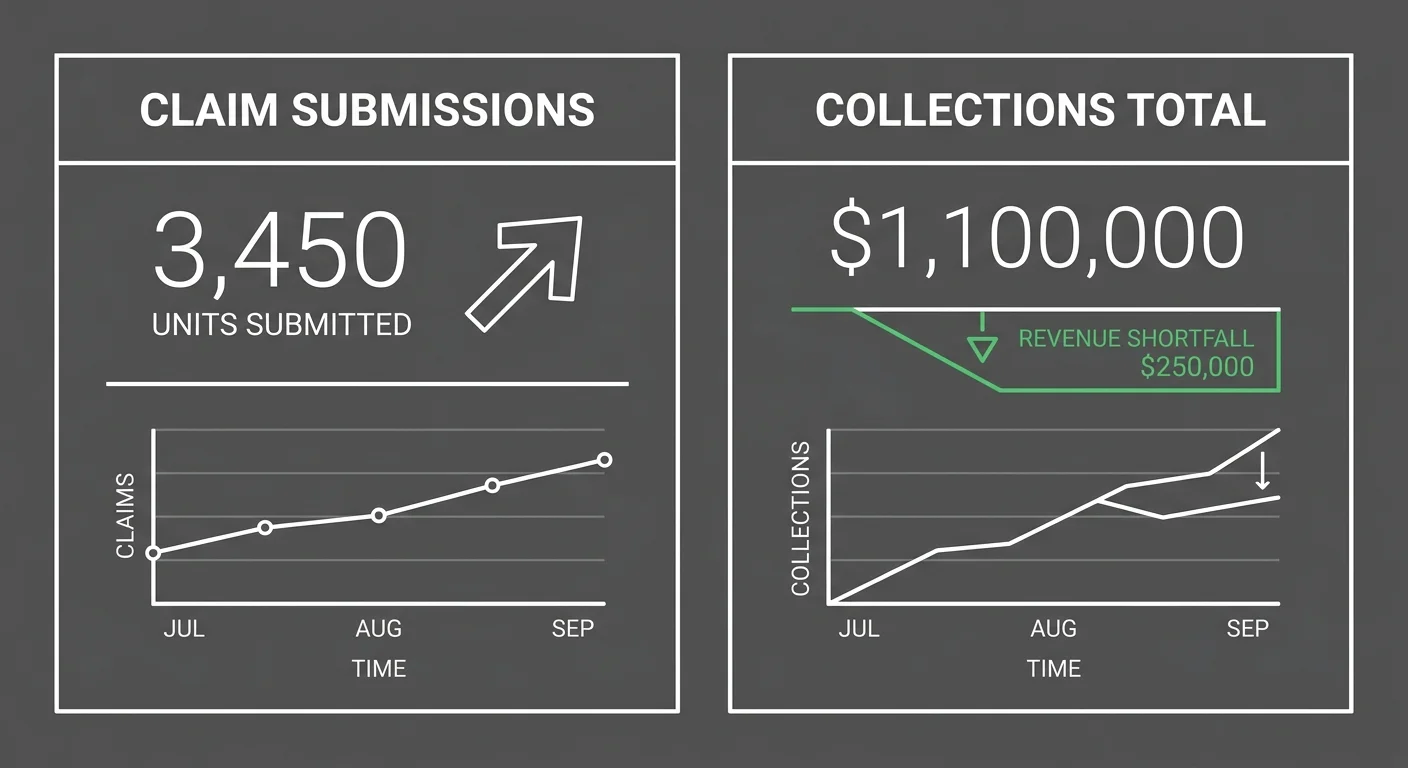
Here’s what most multi-site groups are actually watching: submission speed. How fast claims go out. How many cleared the clearinghouse this week. That’s it.
That’s Submission Visibility – and stopping there is the single most expensive mistake a growing chiropractic group can make.
Submitted isn’t paid. Accepted isn’t collected.
The gap between those two sentences is where revenue disappears. And most billing operations are built to track only the first half of that equation.
This isn’t a technology problem. Practices have dashboards. They have reports. They have clearinghouse portals and EHR billing modules with color-coded status flags.
But none of that tells you what those submissions actually collected. Without Collections Alignment – a real-time view of collected revenue against billed claims – every metric you’re watching measures activity. Not outcomes. And those are very different numbers.
The Submission-vs-Collections Confusion
The confusion runs deep because submission volume feels like revenue health. Claims go out on time. Clearinghouse acceptance rates look clean. Nothing flags red on the weekly report.
So leadership assumes the billing is working. That assumption is wrong – and published outpatient claims data makes the cost of that assumption hard to ignore.
Here’s the number that breaks the assumption: between 5% and 10% of outpatient medical claims are denied on first submission. Of those denials, up to 65% are never worked or resubmitted.
Those claims don’t show up on a submission dashboard. They don’t trigger a flag. They just age – and eventually they’re gone.
At one location, that leakage is painful. At five or ten locations running disconnected billing protocols, it’s a structural cash flow problem dressed up as a reporting gap.
And that’s what makes it dangerous. The confusion between submissions and collections doesn’t just obscure the problem. It actively shields the problem from being found – because the dashboard looks fine right up until the AR is unrecoverable.
Why Volume-First Billing Hides the Problem
Volume-first billing is built for throughput. The incentive is getting claims out the door fast – not recovering what those claims are actually worth.
Clean claims get paid. Complex claims get deprioritized. And the claims that need a multi-step denial appeal, a documentation correction, or a medical necessity argument? Those don’t fit a high-throughput model. So they get skipped.
Those claims sit. Then they age. Then they cross 90 days, then 120, then past the point where most payers will process an appeal at all.
The published analysis of healthcare billing waste identifies administrative billing complexity – not clinical cost – as the single largest driver of waste across the entire healthcare system. Volume-first billing doesn’t reduce that complexity. It buries it.
For multi-site groups trying to scale without proportionally expanding administrative infrastructure, that buried complexity compounds fast.
Every new location added under a volume-first model adds another layer of hidden denial exposure. None of it shows up in a submission dashboard. None of it triggers an alert. It just ages – until the AR is past recovery and someone finally asks where the money went.
An embedded billing partner structured around actual collections recovery changes the operational incentive entirely. When the billing model is performance-aligned – when the partner gets paid when the practice gets paid – high-complexity claims aren’t deprioritized.
They’re the whole point. That’s the shift from Submission Visibility to Collections Alignment. And it’s the only move that closes the gap.
| Metric Type | What It Measures | What It Misses | Risk to Multi-Site Group |
|---|---|---|---|
| Claim Submission Rate | How many claims were sent to payers in a given period | Whether those claims were accepted, denied, partially paid, or ignored entirely | Leadership reads high submission volume as revenue health – while denied and unworked claims quietly age undetected |
| Clearinghouse Acceptance Rate | Whether claims passed initial formatting and eligibility checks at the clearinghouse level | Payer-level adjudication outcomes – acceptance at the clearinghouse does not mean payment by the payer | A clean clearinghouse report creates false confidence; denial exposure downstream stays invisible |
| Submission Visibility (Layer 1) | Activity – claims sent, accepted, and in queue across locations | Collections outcome – what those submissions actually produced in recovered revenue | Multi-site groups managing five or more locations can show strong submission metrics while carrying significant unworked AR across individual sites |
| Collections Alignment (Layer 2) | The ratio of submitted claim value to actual collected revenue by location | Location-level variance – one high-performing clinic can mask two underperforming ones inside a blended group average | Without site-level collections data, resource allocation decisions are made on aggregated numbers that hide individual performance gaps |
| Denial Cycle Accountability (Layer 3) | Whether denied claims are being worked, appealed, and resolved within payer timelines | The volume and aging of unworked denials – claims that were denied and never resubmitted | High-complexity denials requiring documentation corrections or multi-step appeals fall outside volume-first billing models – they age silently past recovery thresholds |
| Location-Level Variance Reporting (Layer 4) | Performance differences between individual clinic sites – denial patterns, AR aging, collections ratios by location | The root cause of variance – whether underperformance traces to coding inconsistency, payer mix, documentation gaps, or billing workflow breakdown | Without site-level isolation, a multi-site group cannot distinguish a structural billing problem from a temporary cash flow fluctuation – and cannot fix what it cannot see |
What Structural Revenue Transparency Actually Requires
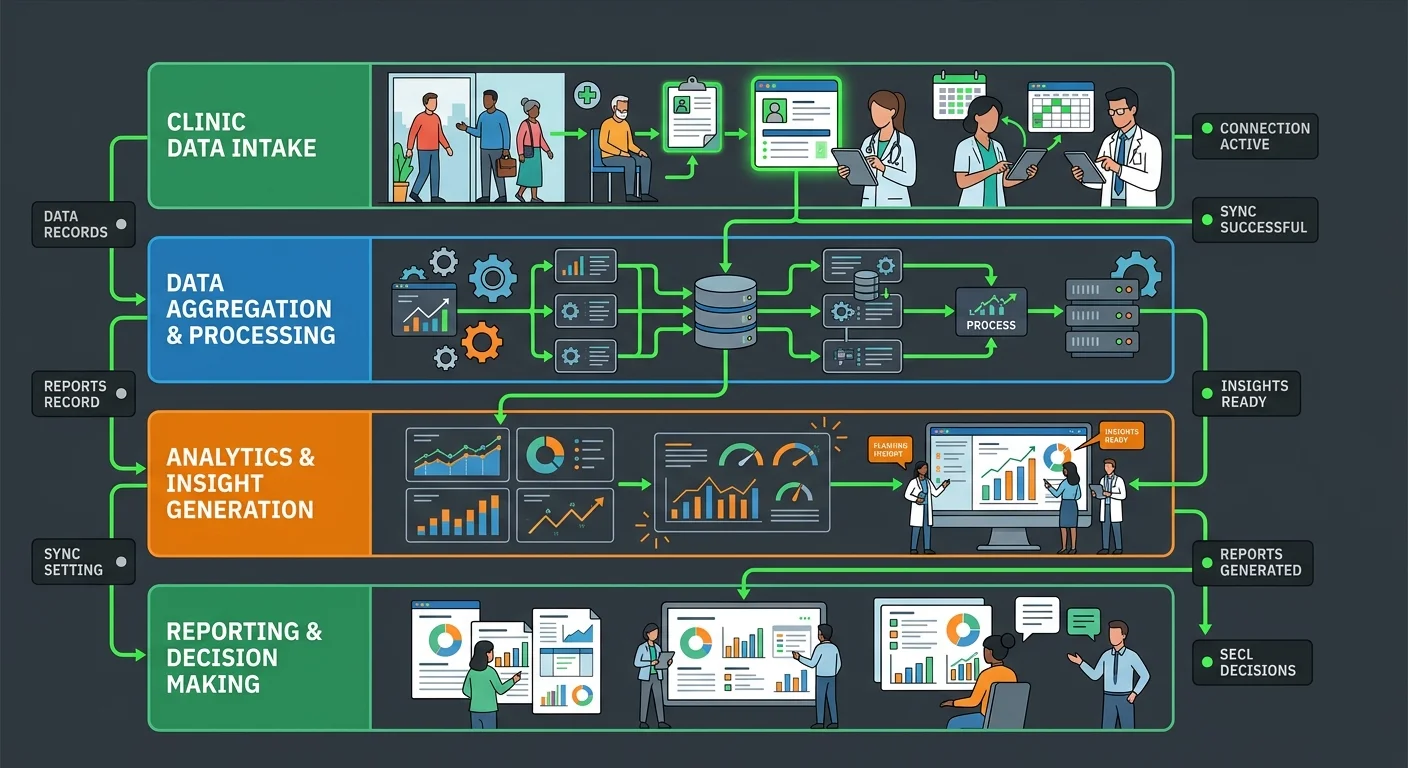
So what does genuine revenue transparency actually look like across multiple locations?
Not dashboard features. Not software modules. The operational disciplines – the things that have to be running, integrated, and visible – before any of the numbers mean anything.
There are four layers.
Not software features – operational disciplines. All four have to be active and integrated at the same time. When they are, a multi-site group has genuine revenue transparency. When even one is missing, there’s a blind spot. And blind spots in a multi-location billing operation don’t stay contained – they compound.
Understanding the scaling performance metrics that actually move revenue – not just claim volume – requires all four layers working together. Each one builds on the last. Pull any single layer and the whole picture fractures.
Transparency Layer 1 – Submission Visibility
Submission Visibility is where every billing operation starts. Claims go out. The clearinghouse accepts them. Payers acknowledge receipt.
Most multi-site groups already have this layer. That’s exactly the problem.
But Submission Visibility confirms activity. It doesn’t confirm revenue.
An operation that measures itself by how many claims went out – while assuming that activity equals collections – is building a gap it won’t find until the AR report is already unworkable. The claims look fine. The money is gone. Those two things are not in conflict when submission is the only layer anyone’s watching.
Transparency Layer 2 – Collections Alignment
Collections Alignment is where submission data gets reconciled against actual payments received. It’s not enough to know what went out. A functioning revenue cycle tracks what came back – by location, by payer, by claim type – and surfaces the gap between the two in real time.
Not at month-end. Not during a quarterly review. In real time, so the gap is visible before it ages past recovery.
NIH-published research confirms that integrating real-time financial tracking directly with clinical workflows significantly increases cash collection-to-billing performance ratios. That’s not a technology claim – it’s an operational one.
Without Collections Alignment, a practice has a submission ledger masquerading as a revenue report. And the difference between those two things is the difference between a practice that knows it’s profitable and one that thinks it is.
Transparency Layer 3 – Denial Cycle Accountability
Denial Cycle Accountability is the layer that separates billing partners who recover revenue from billing vendors who just submit claims.
Denials aren’t a surprise. They’re a predictable pattern. A transparent revenue cycle operation tracks every denial by type, by payer, by location, and by outcome – every time.
Decentralized clinical models produce billing workflow variance. That variance produces revenue leakage – through non-standardized coding, siloed processes, and no one accountable for what falls through.
Denial Cycle Accountability forces that variance into the open. Every unworked denial. Every missed appeal window. Every claim that aged past recovery – visible, attributed, and accountable to a specific location, a specific payer, a specific biller.
The published transparency guidelines from CMS mandate standardized, machine-readable billing data – with direct penalties for non-compliance. The underlying principle is the same one that applies internally: hiding billing complexity doesn’t make it go away. It moves the cost downstream.
Denial Cycle Accountability refuses to let that happen on the inside. The denials don’t disappear – they get worked, appealed, or written off with a documented reason. Either way, there’s a record. Either way, someone is answering for the outcome.
Transparency Layer 4 – Location-Level Variance Reporting
Location-Level Variance Reporting is the layer that makes the first three meaningful in a multi-site environment.
A group-level collections report tells you how the enterprise is performing. It doesn’t tell you which location is dragging it down – or why. And in a multi-site group, that distinction is the whole game.
Here’s what happens without variance reporting: a high-performing location masks a struggling one. Leadership sees blended numbers, makes blended decisions, and the underperforming clinic keeps burning revenue while the consolidated report stays green.
That isn’t transparency. That’s averaging the problem into invisibility.
Full-service insurance billing built around all four layers – Submission Visibility, Collections Alignment, Denial Cycle Accountability, and Location-Level Variance Reporting – isn’t a premium configuration for large enterprise groups.
It’s the minimum viable structure for any multi-site practice that wants to know what’s actually happening with its revenue. Anything less is a submission tracker wearing a transparency label. And the difference shows up in the AR report – usually long after the window to recover it has closed.
| Transparency Layer | What It Tracks | Multi-Site Risk Without It | Reporting Cadence |
|---|---|---|---|
| Submission Visibility | Claims transmitted, clearinghouse acceptance rates, payer acknowledgment of receipt | Operation measures activity instead of revenue – submission volume signals health while collections gaps grow undetected | Real-time / continuous |
| Collections Alignment | Actual payments received reconciled against submitted claims – by location, by payer, by claim type | Submission ledger gets mistaken for a revenue report – the delta between what went out and what came back stays invisible | Weekly, reconciled against submission data |
| Denial Cycle Accountability | Every denial by type, payer, location, and outcome – including appeal status and claims aging past recovery windows | Unworked denials age silently, appeal windows close, and revenue disappears without triggering any flag in the submission dashboard | Weekly tracking, monthly pattern review |
| Location-Level Variance Reporting | Site-by-site performance differences in collections rates, denial volumes, AR aging, and coding consistency | High-performing locations mask underperforming ones inside blended group totals – leadership makes enterprise decisions on incomplete data | Monthly by site, quarterly cross-location comparison |
The Transparency Gap by Location
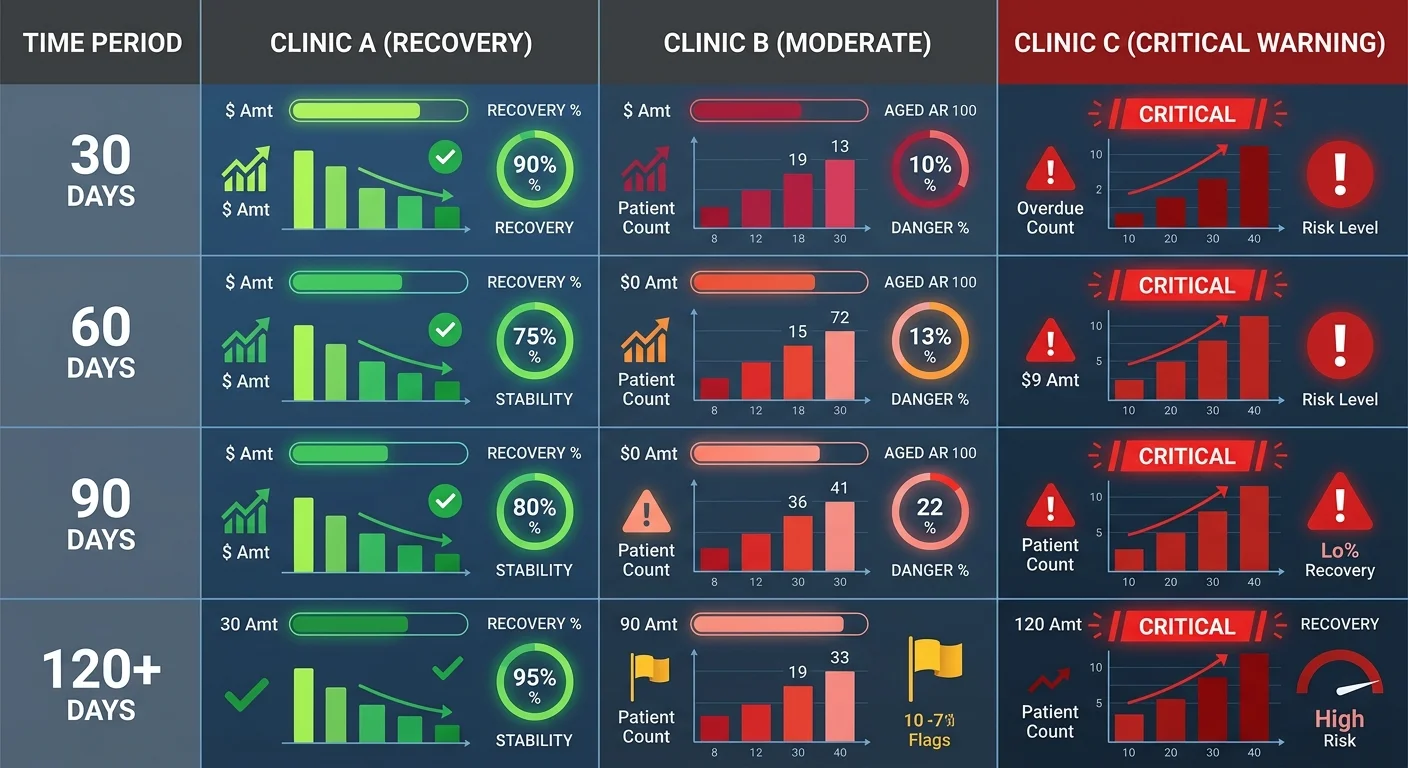
System-level transparency sounds clean. But the accountability problem in a multi-site group doesn’t live at the system level.
It lives at the location level – where variance hides inside blended reports, invisible until it’s already too late to recover.
Multi-unit groups without centralized transparency carry more aged AR. Not because they’re billing less – because they can’t see what’s dying.
Those reporting delays don’t send a warning. They accumulate location by location, quarter by quarter. By the time the damage registers in cash flow, the most recoverable claims are already past the point of return.
Here’s what’s actually driving those delays: each location runs its own billing rhythm. Its own follow-up cadence. Its own window for working a denial. Its own threshold for when to write off a claim and move on.
Disconnected billing protocols don’t stay contained to the location that created them. The group’s revenue health ends up determined by whoever has the loosest standards. And leadership almost never knows which location that is – until the AR report stops making sense.
How Location-Level Variance Compounds Across a Group Practice
Here’s what makes it worse at scale: the locations performing worst are usually the ones contributing the least visibility to the group report.
Their claims age past 90 days. Their denials go unworked. Their AR report looks full – but full of receivables that are already dead. Meanwhile, the group-level number blends their performance into the average. The signal disappears. And no one is looking at the right location.
Put it in concrete terms for a five-location group: five different interpretations of how to handle a modifier dispute. Five different timelines for working a denied claim. Five different escalation thresholds before someone decides to write it off.
That’s not a coordination problem. That’s a leakage structure. And the leakage compounds because no single location sees the full picture – only the group sees it, and only if the reporting is built to show it.
Groups that try to solve this by automating patient invoicing and collections before Location-Level Variance Reporting is in place don’t close the gap. They accelerate it.
Automation applied to a broken workflow doesn’t fix the workflow. It executes the same broken steps faster. The variance has to be visible first – before any intervention, automated or manual, can be calibrated to actually work.
Who This Model Is Not Built For
This model isn’t built for every practice.
That’s not a disclaimer. It’s a filter.
If the first question when evaluating a billing partner is "what’s your rate?" – this conversation ends there.
Not because the question is wrong. Because the answer tells you nothing useful. It doesn’t tell you whether denied claims get worked. Whether variance gets tracked by location. Whether unworked AR is aging past recovery while someone watches a submission dashboard and calls it performance.
Price determines cost. These four transparency layers determine revenue. Practices that conflate those two conversations end up paying less for a billing relationship that quietly costs them more.
And if the goal is a silent background arrangement – no provider availability for appeals, no EHR access cooperation, no documentation turnaround when a denial requires it – none of these four layers will function. Full stop.
Denial Cycle Accountability requires access. Collections Alignment requires cooperation. Location-Level Variance Reporting requires a partner who can see inside each location – not just receive a claim file and wait.
Structural revenue transparency is an embedded partnership. Practices that aren’t ready to operate that way aren’t the right fit. The Key Performance Indicators (KPIs) for Scaling a Chiropractic Enterprise will make that gap visible – whether the practice chooses to look at them or not.
| Location Scenario | Visible in Standard EHR Dashboard | Visible Only With Structural Transparency | AR Aging Risk |
|---|---|---|---|
| Single location with centralized billing | Claim submission status, payer acknowledgment, basic payment posting | Denial pattern by payer and claim type, unworked AR by age bucket, collections-to-submission delta | Low – billing irregularities surface quickly at single-location scale |
| Multi-site group with blended group-level reporting | Aggregate claim volume, total submissions across all locations, combined payment totals | Which location is generating aged AR, which payer relationships are underperforming by site, where denial cycles go unworked | High – underperforming locations are averaged into the group number and stay invisible |
| Location running disconnected billing protocols from the group | Claims submitted and accepted by clearinghouse | Modifier disputes handled inconsistently, denial follow-up timelines misaligned with group standard, local AR thresholds for write-offs | Very high – revenue leakage accumulates silently before it appears in any consolidated report |
| New clinic location added to existing group | Initial claim submissions and payer enrollment status | Variance in denial rate versus established locations, credentialing gaps affecting reimbursement, AR aging trajectory in first 90 days | Elevated – billing workflow gaps at new locations are structurally invisible without location-level variance reporting |
| High-volume location masking a low-performer in group report | Combined collections total that appears healthy at the group level | Revenue drag attributed to specific location, payer mix differences driving denial rate divergence, aged AR concentrated at one site | Critical – group leadership makes resourcing decisions based on blended data that hides the actual source of the problem |
| Multi-site group with EHR submission dashboard as primary reporting tool | Claim sent, clearinghouse accepted, payer acknowledged receipt | Actual cash collected versus billed by location, denial cycle outcomes, claims aged past recovery threshold with no appeal on record | Systemic – submission confirmation is mistaken for revenue confirmation across every location simultaneously |
Implementing Revenue Transparency Across Multiple Clinic Locations
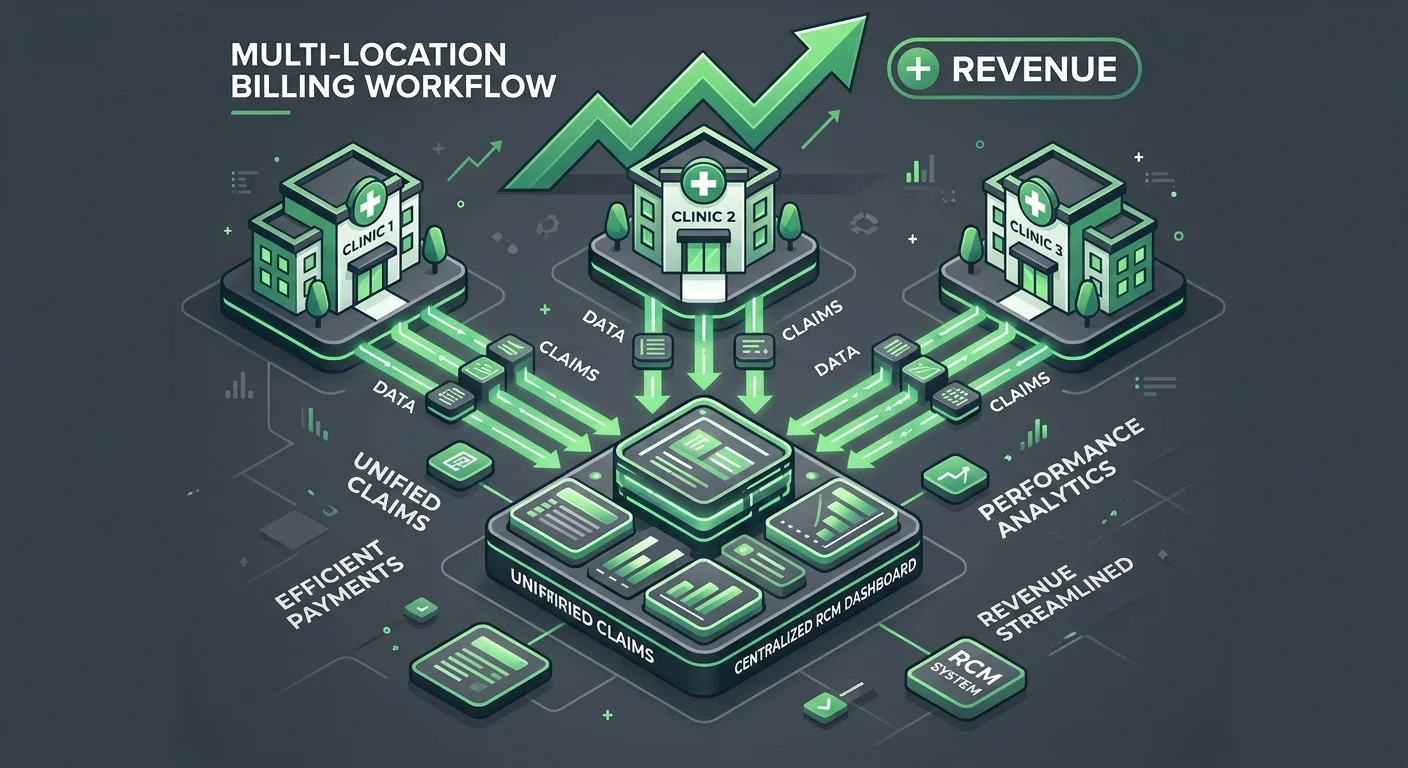
Knowing the four layers tells you what’s broken. Building them is the actual job – and it has to start before the first new location opens, not after.
Most multi-site groups don’t fail at transparency because they didn’t care. They fail because they scaled before they standardized.
Every new location inherited the billing habits of whoever set it up. Those habits diverged quietly. And by the time anyone noticed the variance, it was already baked into the model.
The sequence matters. Standardize first. Build the reporting cadence second. Scale third.
Reverse that order and a group ends up with six locations and six different interpretations of what working a denial actually means.
Standardizing RCM Workflows Before Scaling
Decentralized clinic models bleed revenue through billing workflow variance – different denial timelines, different modifier habits, different AR thresholds at every location. That’s not a technology problem. No software layer fixes it. The workflow has to be uniform across every location before any tool can measure it accurately.
So what does standardization actually mean? Same denial response timeline at every location. Same AR escalation threshold. Same modifier documentation standard – no local interpretations, no inherited shortcuts from whoever set up that office.
Siloed workflows don’t disappear just because a group shares an EHR. Technical connection isn’t workflow alignment. Those are two different things, and conflating them is exactly how leakage hides.
The same discipline applies upstream. Practices that don’t bring the same rigor to provider credentialing and enrollment as each new clinician joins create payer enrollment gaps that feed directly into future denial cycles.
Standardization also determines what Location-Level Variance Reporting can actually tell you.
If every location handles denials differently, the variance report just shows you the output of chaos. Not a performance signal – noise. The standard has to come first. Reporting measures deviation from it. That sequence is non-negotiable.
Building the Reporting Cadence That Keeps Every Location Accountable
Standardized workflows create the conditions. The reporting cadence is what keeps every location honest.
Operational reporting delays directly correlate with AR aging past 90 days in multi-unit clinical models. That’s a documented pattern, not a theory. But the fix isn’t more data – it’s data delivered on a consistent schedule, at a frequency that makes drift visible before it becomes a cash flow problem.
When real-time financial tracking integrates directly with clinical workflows, cash collection-to-billing performance ratios improve – because the gap between submission and actual payment stops being invisible.
That’s what happens when a reporting cadence is built around Collections Alignment instead of submission volume. Weekly visibility into what came back – by location, by payer, by claim type – closes the submission-versus-collections gap before it compounds.
For groups exploring how to automate patient invoicing and collections across multi-site clinics, that automation only delivers reliable results when this cadence is already in place.
Here’s what a weekly cadence does that an annual audit can’t: it removes the hiding place.
When every location sees its own variance report – denial rates, AR aging, collections-to-submissions ratio – underperformance can’t dissolve into a blended group number. The locations dragging the enterprise down become visible. And visible problems get fixed.
That’s the structural shift from submission tracker to genuine transparency model. It doesn’t just report what happened. It forces a response.
| Implementation Phase | Primary Action | What Gets Resolved | Timeline Benchmark |
|---|---|---|---|
| Phase 1 – Workflow Standardization | Align denial response timelines, AR escalation thresholds, and modifier documentation standards across every location | Eliminates the multi-interpretation problem – every location follows the same rules before any reporting layer is applied | Complete before adding any new locations or billing technology |
| Phase 2 – Reporting Infrastructure | Build location-level reporting cadence that delivers denial rates, AR aging, and collections-to-submissions ratios on a consistent weekly schedule | Replaces blended group numbers with individual location performance signals – underperformance becomes visible instead of averaged away | Established concurrent with or immediately after workflow standardization |
| Phase 3 – Collections Alignment Activation | Shift the performance benchmark from claims submitted to claims paid – track what came back by location, payer, and claim type | Closes the submission-versus-collections gap; billing performance is now measured by actual revenue recovery, not throughput speed | Operational once reporting cadence produces at least one full billing cycle of clean comparative data |
| Phase 4 – Denial Cycle Accountability | Assign explicit denial response ownership at each location – every denied claim has a tracked appeal status, escalation window, and resolution outcome | Stops unworked denials from aging silently past recovery; the locations abandoning high-complexity claims become identifiable | Requires standardized workflows and active reporting to function – cannot be layered onto a chaotic billing foundation |
| Phase 5 – Location-Level Variance Reporting | Deploy cross-location variance analysis that surfaces which clinics deviate from group RCM standards – by payer, claim type, and AR age bucket | Removes the structural cover that blended group reporting provides to underperforming locations; leadership can act on specific signals instead of aggregate assumptions | Sustainable only after Phases 1 through 4 are in place – variance reporting measures deviation from a standard, so the standard must exist first |
Frequently Asked Questions
Every group practice that gets serious about RCM visibility runs into the same questions. Here’s where they actually come from – and what the answers require.
These aren’t theoretical. They’re what surfaces the moment a group practice stops assuming its billing is working and starts checking.
How long does it take to establish full revenue cycle transparency across three or more clinic locations?
The timeline varies. The sequence doesn’t.
Standardization comes first – and it can’t be skipped. Every location needs the same denial response window, the same AR escalation threshold, the same modifier documentation standard before any reporting cadence tells you anything useful. That foundation takes real time to build correctly.
Once workflows are uniform, the reporting layers activate. Collections alignment and denial cycle accountability can come online fast once the underlying process is consistent. Location-level variance reporting is always last – it only delivers a performance signal when there’s an actual standard to measure deviation against.
Groups that shortcut this – launching reporting before the workflow is standardized – end up measuring chaos. The timeline isn’t the variable that matters. The sequence is.
What is the most common operational failure point when transitioning a multi-site clinic to centralized financial reporting?
The most common failure point is treating centralized reporting as a technology project. Groups invest in a shared EHR or a consolidated dashboard and assume visibility follows automatically.
It doesn’t.
The dashboard surfaces data. But if every location is still working denials on its own timeline, escalating AR on its own threshold, and handling modifier disputes its own way – the dashboard reports variance without explaining it. Leadership sees the numbers and has no context to act on them.
Centralized reporting requires standardizing the workflow first. The reporting tool is the last layer added, not the first. Groups that reverse that order spend months watching a dashboard that shows them problems they can’t fix – because the underlying process is still decentralized.
How does billing vendor silence mask unworked accounts receivable in larger chiropractic group practices?
Billing vendor silence works because it’s invisible by design. When a vendor stops working a denied claim – too complex, too labor-intensive, or past the window a volume model allows – the claim doesn’t disappear from the AR report. It just sits there aging.
In a multi-site group, that aging compounds across locations. Outpatient denial rates run between 5% and 10% on first submission. Up to 65% of those denials are never worked or resubmitted. That math plays out across every location simultaneously – and none of it surfaces as a visible problem until someone reads the AR report carefully enough to notice how many line items haven’t moved in 60, 90, or 120 days.
Groups without denial cycle accountability don’t catch this until the claims are past recovery. The silence isn’t a communication style. It’s a structural feature of billing models that aren’t built to work the hard claims – and in a multi-site operation, it scales with every location you add.
Why do multi-site clinical providers sometimes resist real-time revenue cycle reporting, and how should management address it?
Resistance comes from one of two places: concern that real-time visibility creates micromanagement, or a belief that the current setup is working well enough that the disruption isn’t worth it.
Both are worth taking seriously. Neither holds up.
On micromanagement: location-level variance reporting surfaces performance patterns, not performance judgments. The goal isn’t surveillance – it’s catching drift before it becomes a cash flow problem. Reporting delays correlate directly with AR aging past 90 days in multi-unit clinical models. That visibility protects the location, not just the group.
On ‘good enough’: the blended group number is the most dangerous metric in a multi-site operation. It absorbs underperformance and makes it invisible. The only way to know whether a location is actually performing – by payer, by claim type, by denial pattern – is to measure it at that level.
When the rationale is framed as revenue recovery rather than oversight, resistance drops.
What EHR integration challenges prevent multi-site groups from tracking claim denial appeal cycles clearly?
The most common integration challenge isn’t technical. It’s structural.
EHR platforms are claim submission tools. They track what goes out. Tracking what comes back – the denial response, the appeal cycle, the resubmission timeline – requires a billing workflow layer most EHR financial modules don’t provide natively.
In a multi-site group, that gap multiplies. Each location may run the same EHR but route denials through different workflows, track appeal cycles in different systems, or rely on the billing vendor to manage the appeal loop with no visibility back into the EHR at all. Real-time financial tracking integration increases cash collection-to-billing performance ratios – but only when the denial appeal cycle is actually tracked and reported, not just initiated.
The fix isn’t a new EHR. It’s a full-service insurance billing partnership with denial cycle accountability built in – where every denied claim has a documented response timeline, a visible appeal status, and a resolution outcome that feeds back into the group’s reporting cadence. That’s the layer most EHR-native dashboards don’t close.
Revenue Transparency Is a Structural Decision, Not a Software Feature
A dashboard that shows claims submitted is not the same as a dashboard that shows claims paid.
That’s not a software problem. It’s a structural one.
The submission-versus-collections gap doesn’t announce itself. It compounds – location by location, denial by denial – until the blended group report still reads green while the actual cash position tells a completely different story.
Structural revenue transparency isn’t a feature you activate. It isn’t a report you run once a quarter to check a box.
It’s something you build into the billing partnership before the gaps become unrecoverable – through all four layers: Submission Visibility, Collections Alignment, Denial Cycle Accountability, and Location-Level Variance Reporting.
Each layer closes a different gap. Together, they force accountability at every location, on every claim, on every denial cycle that would otherwise age past recovery in silence.
That’s the shift. Not a better dashboard – a different architecture entirely.
Bushido Billing is built around that architecture. The practices that benefit from it aren’t shopping for a submission tracker wearing a transparency label – they’re ready for a billing partnership that holds every location to the same standard, surfaces variance before it compounds, and ties every RCM metric to what actually gets collected.
That’s not a tool you buy. That’s a decision you make before the next location opens.
Because a dashboard that shows claims submitted is not the same as a dashboard that shows claims paid. And the practices that never close that gap don’t discover it gradually.
They discover it when the damage is already done.
Here’s the question worth asking right now: does your current billing setup show you what was submitted – or what was actually paid?
Those aren’t the same number. And in a multi-site group, the gap between them doesn’t stay small.
If you can’t see that difference by location, by payer, by denial cycle – you’re not running on revenue transparency. You’re running on assumptions. And assumptions are where group practice revenue quietly disappears.

© . All Rights Reserved | Web Design by iTech Valet